Highlight segments of a query or target genome in a dot plot
Source:R/dotplot.R
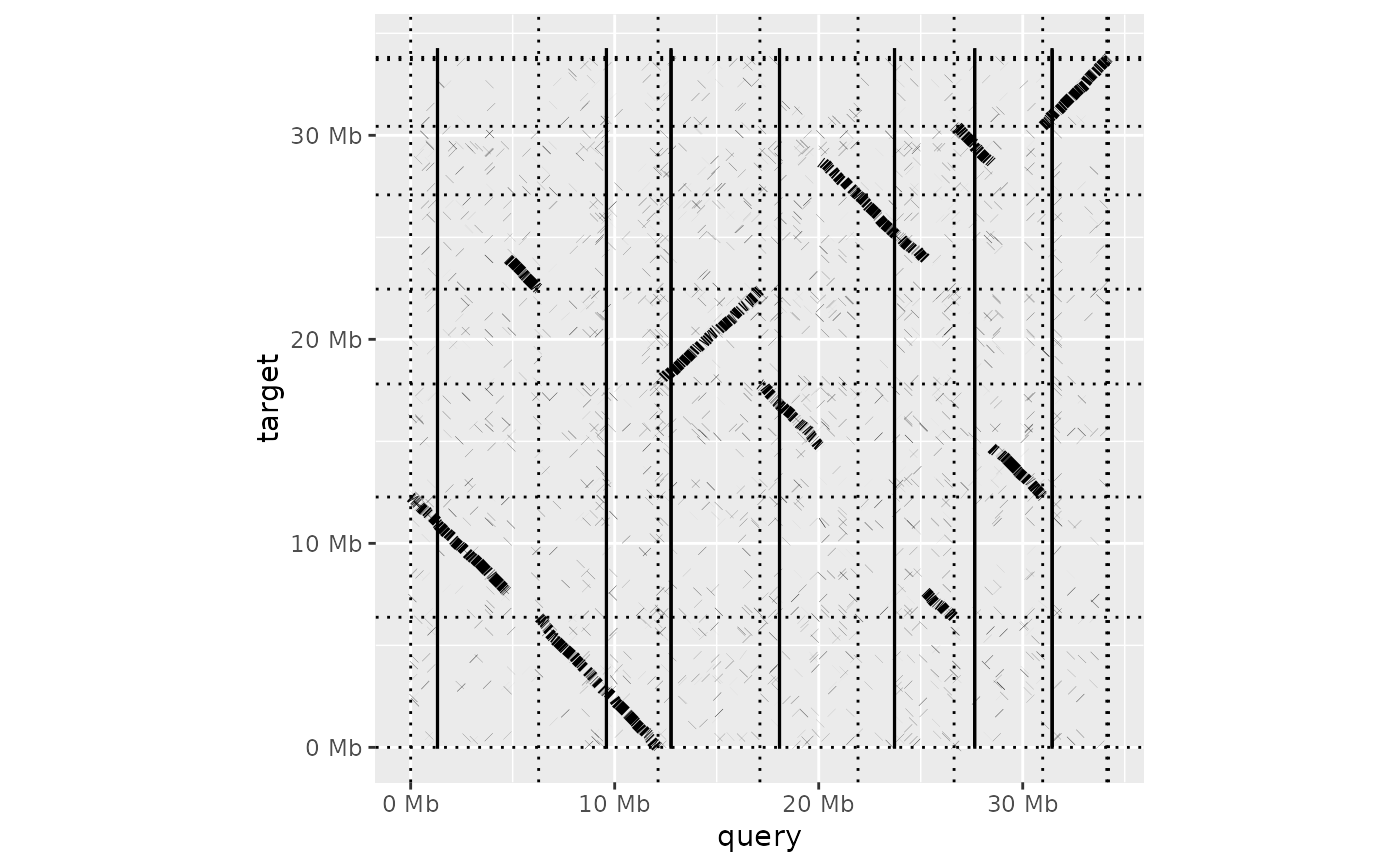
highlight_dotplot.RdThis plot is intended to be used in conjunction with link{dotplot}.
Adding higlight_query or highlight_target to a dotplot function call
(see examples below) will add a rectangular 'highlight' corresponding to a
particular genomic interval in the corresponding genome.
highlight_query(bed, fill = "yellow", colour = "black", alpha = 0.6)

highlight_target(bed, fill = "yellow", colour = "black", alpha = 0.6)
Arguments
| bed |
|
|---|---|
| fill | character Fill colour for highlight segment |
| colour | character Outline colour for highlight segment |
| alpha | character Opacity ([0-1]) for highlight segment |
Examples
ali <- read_paf( system.file("extdata", "fungi.paf", package="pafr") ) cen <- read_bed(system.file("extdata", "Q_centro.bed", package="pafr")) dotplot(ali) + highlight_query(cen)interval <- data.frame(chrom="T_chr3", start=2000000, end=3000000) dotplot(ali, label_seqs=TRUE) + highlight_target(interval)