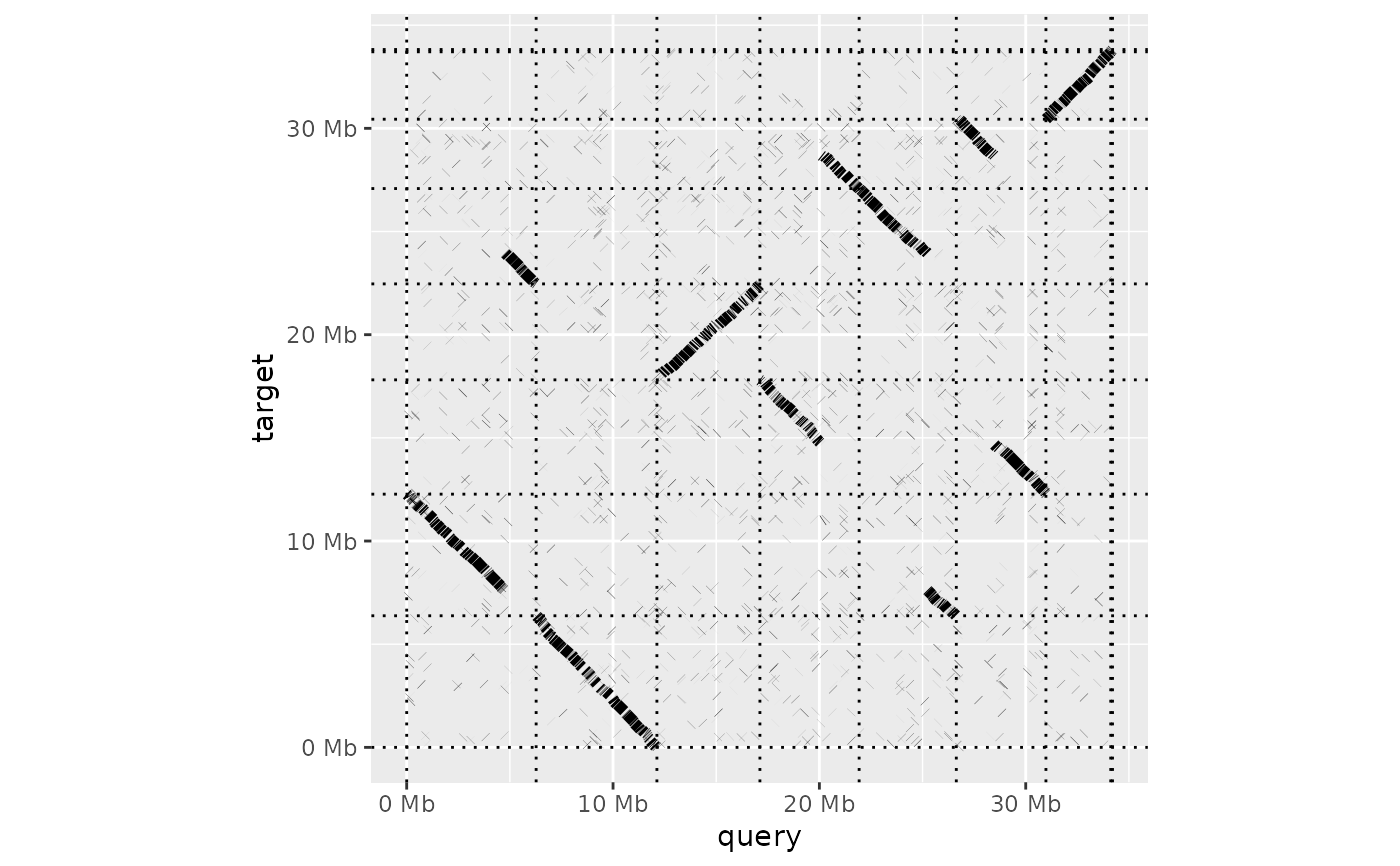
Generate a dot plot from a paf alignment
dotplot(
  ali,
  order_by = c("size", "qstart", "provided"),
  label_seqs = FALSE,
  dashes = TRUE,
  ordering = list(),
  alignment_colour = "black",
  xlab = "query",
  ylab = "target",
  line_size = 2
)
Arguments
| ali | pafr or tibble containing the genome alignment (as returned by
|
|---|---|
| order_by | How the query and target sequences should be ordered in the
dot plot. Option must be one of 'size' (smallest-to-largest), 'qstart' (query organised
smallest to largest, target by first match in the query genome) or 'provided'
(ordering as specified in the |
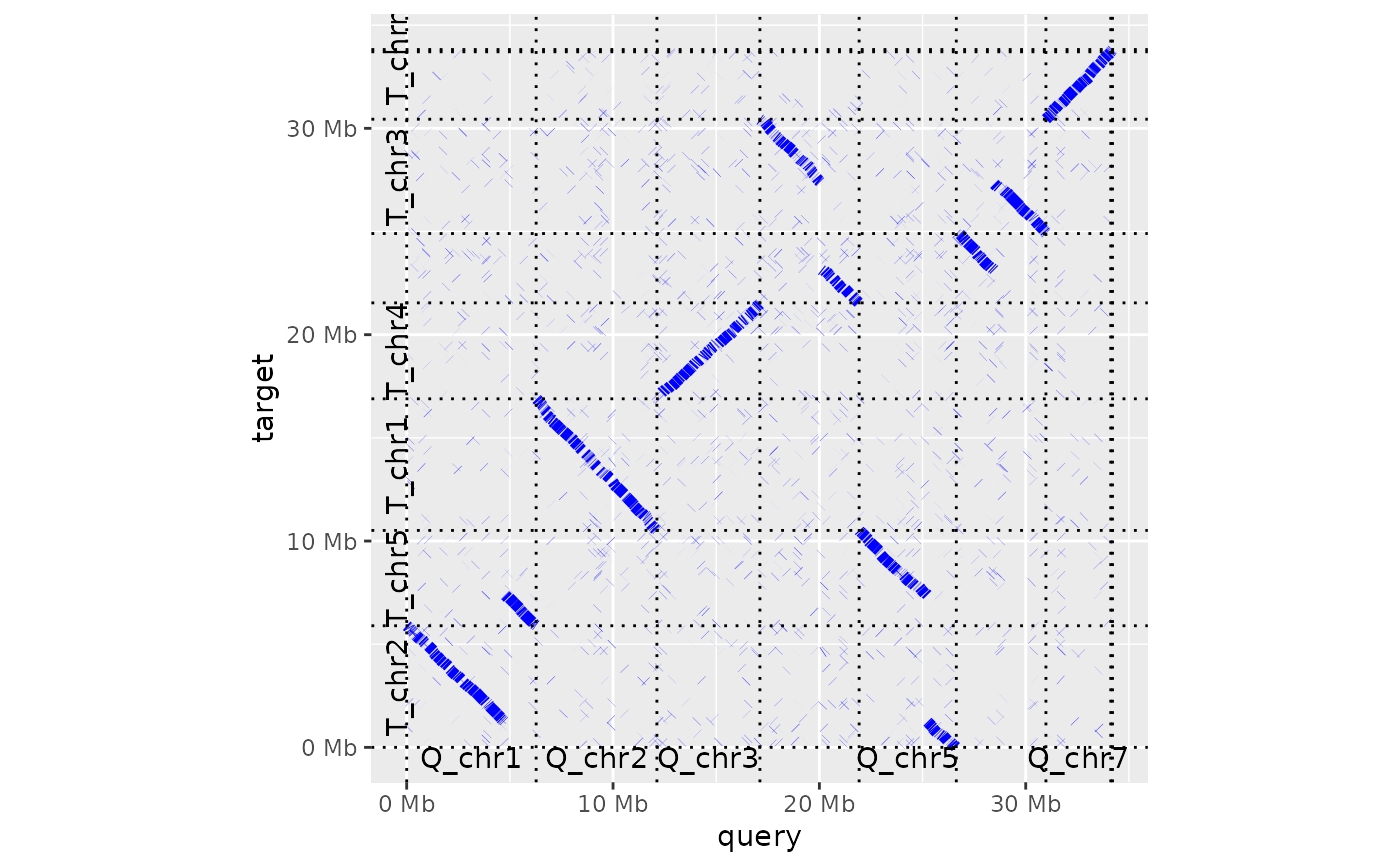
| label_seqs | boolean If TRUE, label centre of query and target sequences in margins of the dot plot |
| dashes | boolean If TRUE, add dashes to borders of query and target sequences in the dot plot |
| ordering | If |
| alignment_colour | character The colour used to draw each aligned section in the dot plot (defaults to black) |
| xlab | character The x-axis label (defaults to 'query') |
| ylab | character The y-axis label (defaults to 'target') |
| line_size | The width of the line used to represent an alignment in the dot plot (defaults to 2) |
Examples
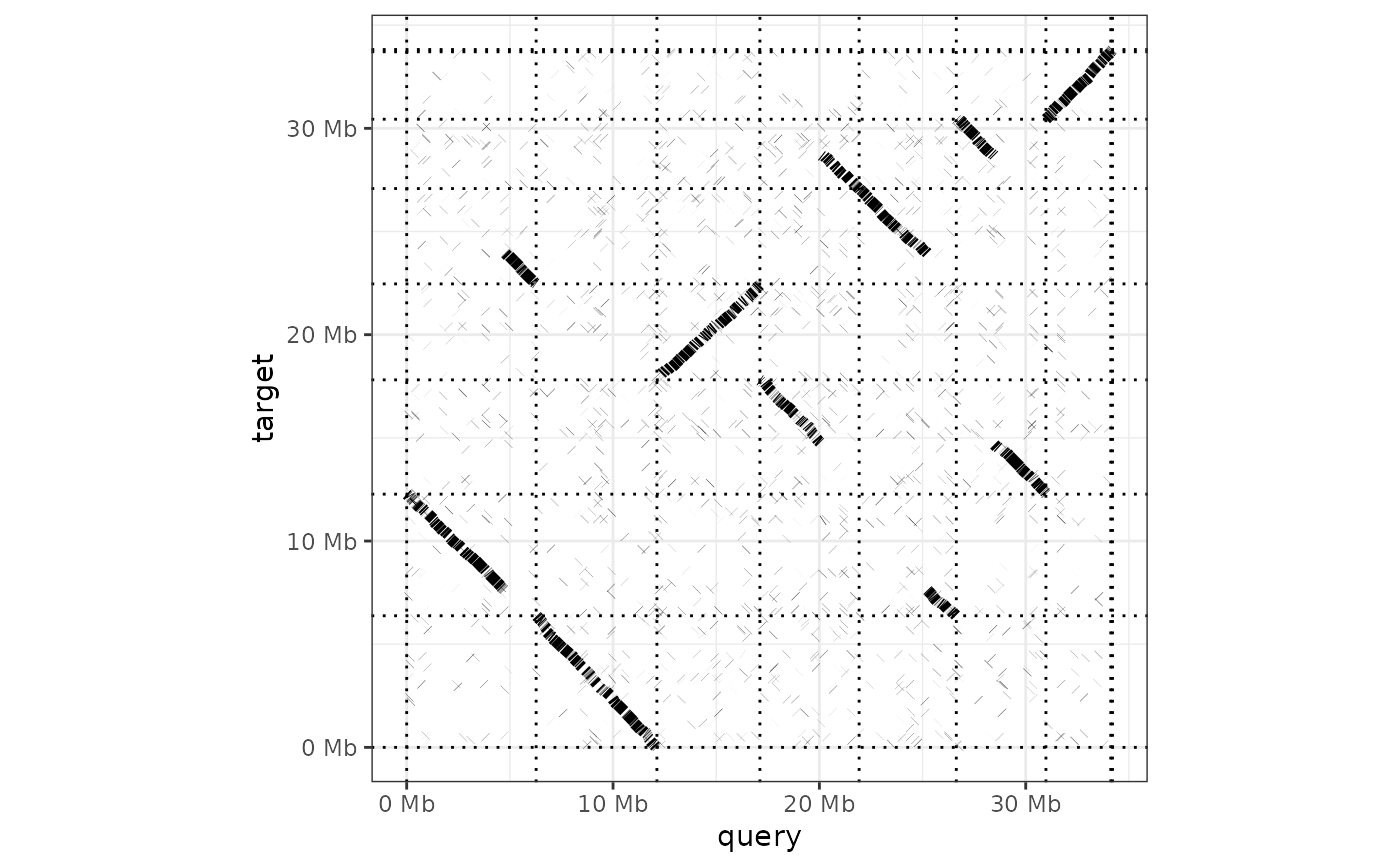
dotplot(ali) + theme_bw()dotplot(ali, label_seqs=TRUE, order_by="qstart", alignment_colour="blue")


