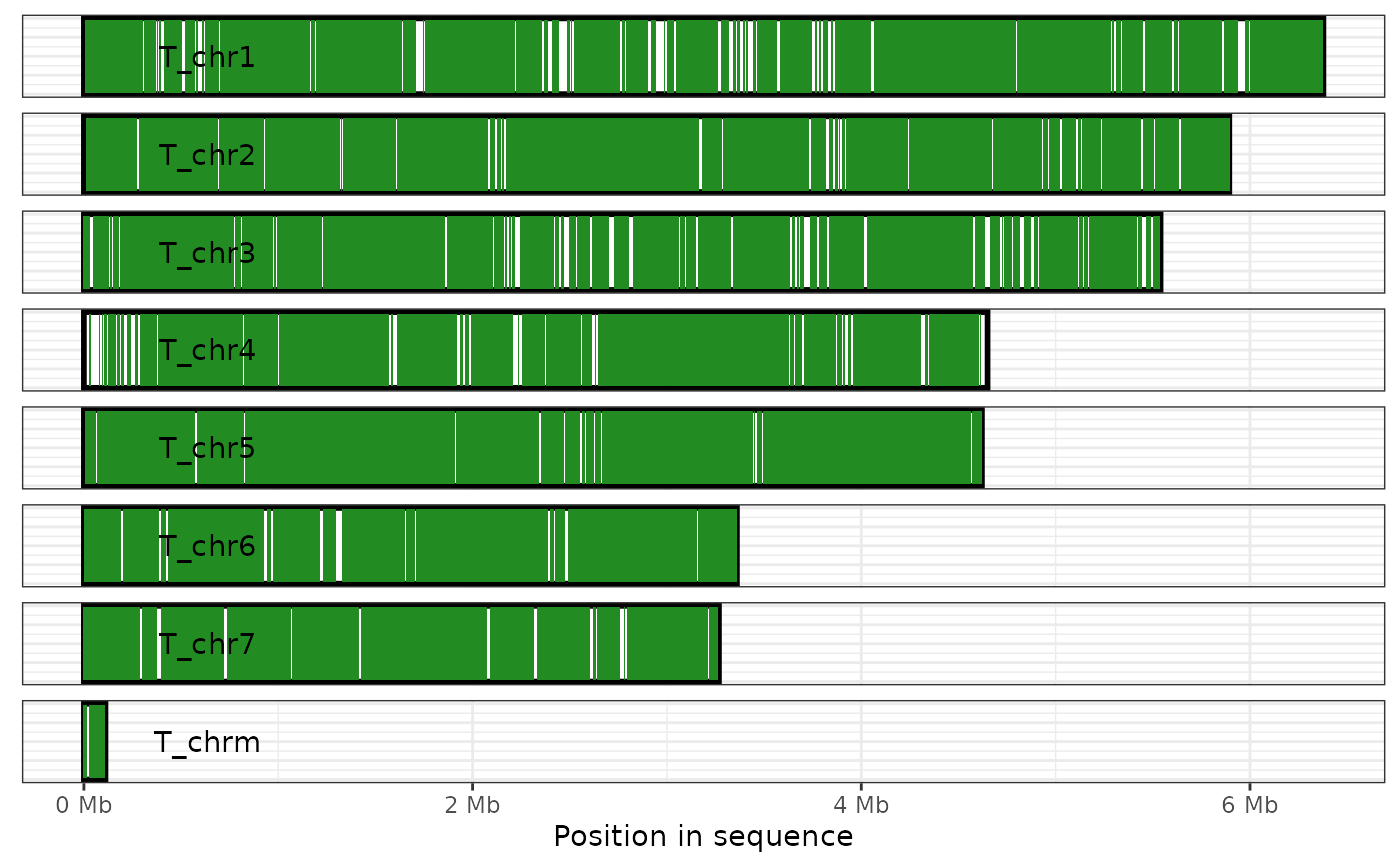
Plot the regions of one genome that are covered by alignments in a paf file
Source:R/coverage_plot.r
plot_coverage.RdEach sequence in the focal genome is displayed as a rectangle, with regions
covered by an alignment shaded as per the fill argument described
below. Uncovered regions remain white.
plot_coverage(
  ali,
  target = TRUE,
  fill = "forestgreen",
  direct_label = TRUE,
  label_colour = "black",
  xlab = "Position in sequence",
  x_labeller = Mb_lab
)
Arguments
| ali | alignment An alignment as read by |
|---|---|
| target | logical If TRUE, display coverage for the target genome; if FALSE, display coverage for the query |
| fill | character How to colour the alignment blocks. If the character
provided is the name of a column in the alignment, this column will be passed
to |
| direct_label | logical If TRUE, use geom_text to directly label the name of the focal sequences; if FALSE, no direct labels are drawn |
| label_colour | character Colour used for direct labels |
| xlab | string Name for the x-axis |
| x_labeller | function Function to be used to label the x-axis (defaults to
|
Details
Note that this function uses theme_coverage_plot to style the
graph. Using another ggplot theme on the plot may produce unexpected results.
Examples
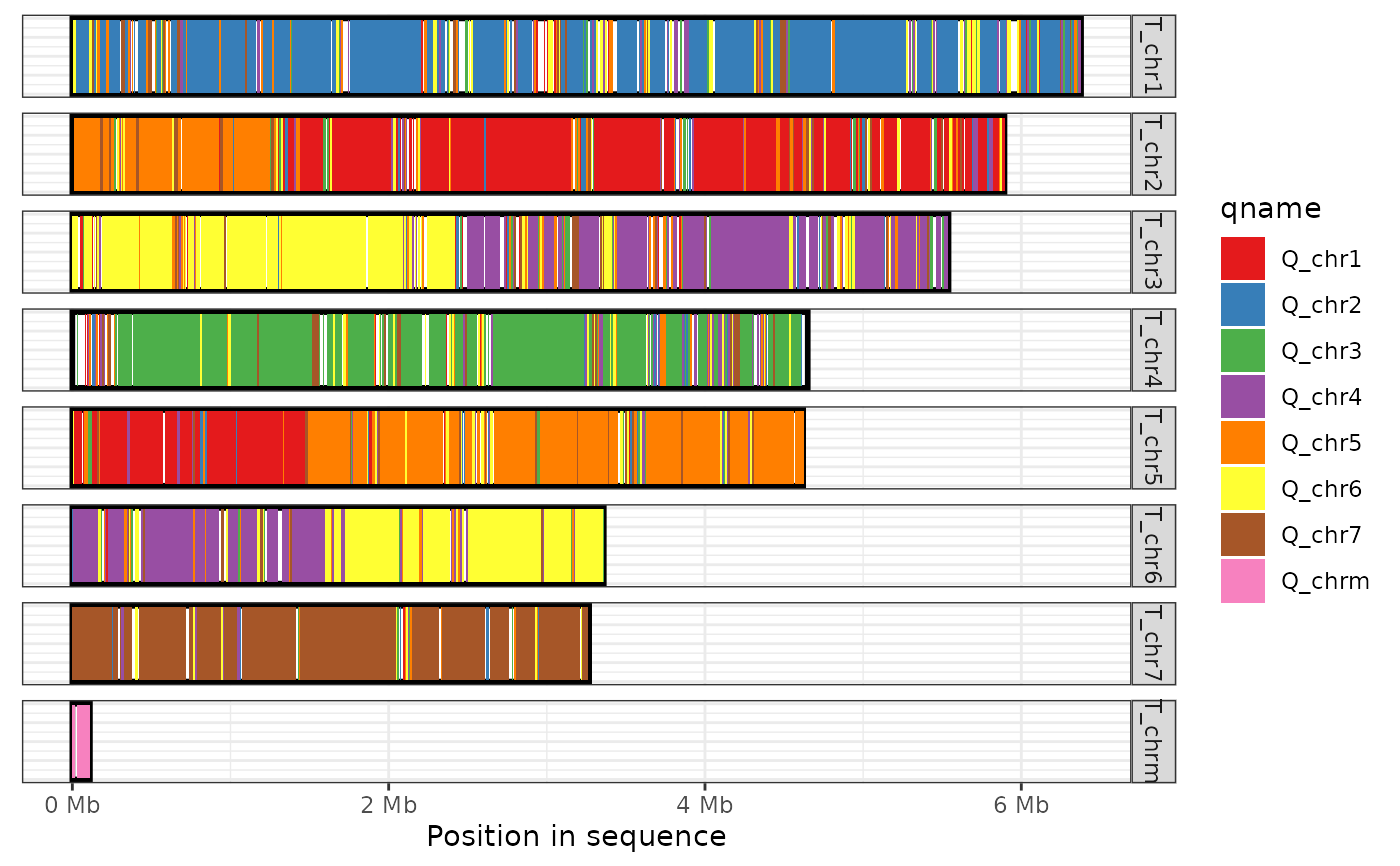
plot_coverage(ali, fill='qname', direct_label=FALSE) + scale_fill_brewer(palette="Set1")

