Plot synteny between a query and target sequence in a PAF alignment
Source:R/synteny.r
plot_synteny.RdPlot synteny between a query and target sequence in a PAF alignment
plot_synteny(
  ali,
  q_chrom,
  t_chrom,
  centre = TRUE,
  rc = FALSE,
  xlab = "Position in query",
  ylab = "",
  x_labeller = Mb_lab
)
Arguments
| ali | pafr or tibble containing the genome alignment (as returned by
|
|---|---|
| q_chrom | character Name for the query sequence |
| t_chrom | character Name for the target sequence |
| centre | logical If TRUE (default), adjust the position of the target sequence, so it is centred on the query. If not, both sequences start at position zero |
| rc | logical If TRUE, use the reverse and complement for the target sequence |
| xlab | string Name for the x-axis |
| ylab | string Name for the y-axis |
| x_labeller | Function to be used to label the x-axis |
Value
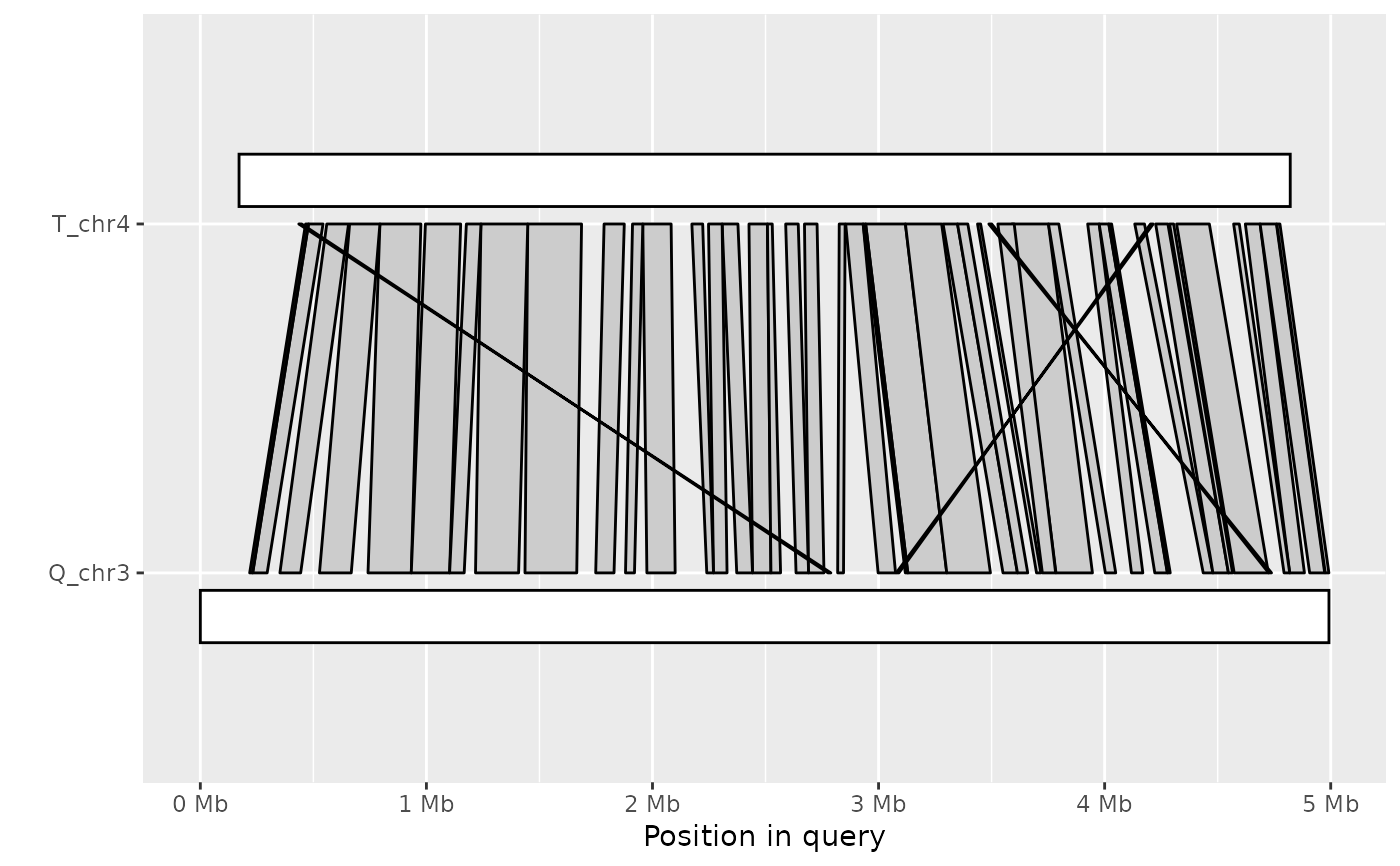
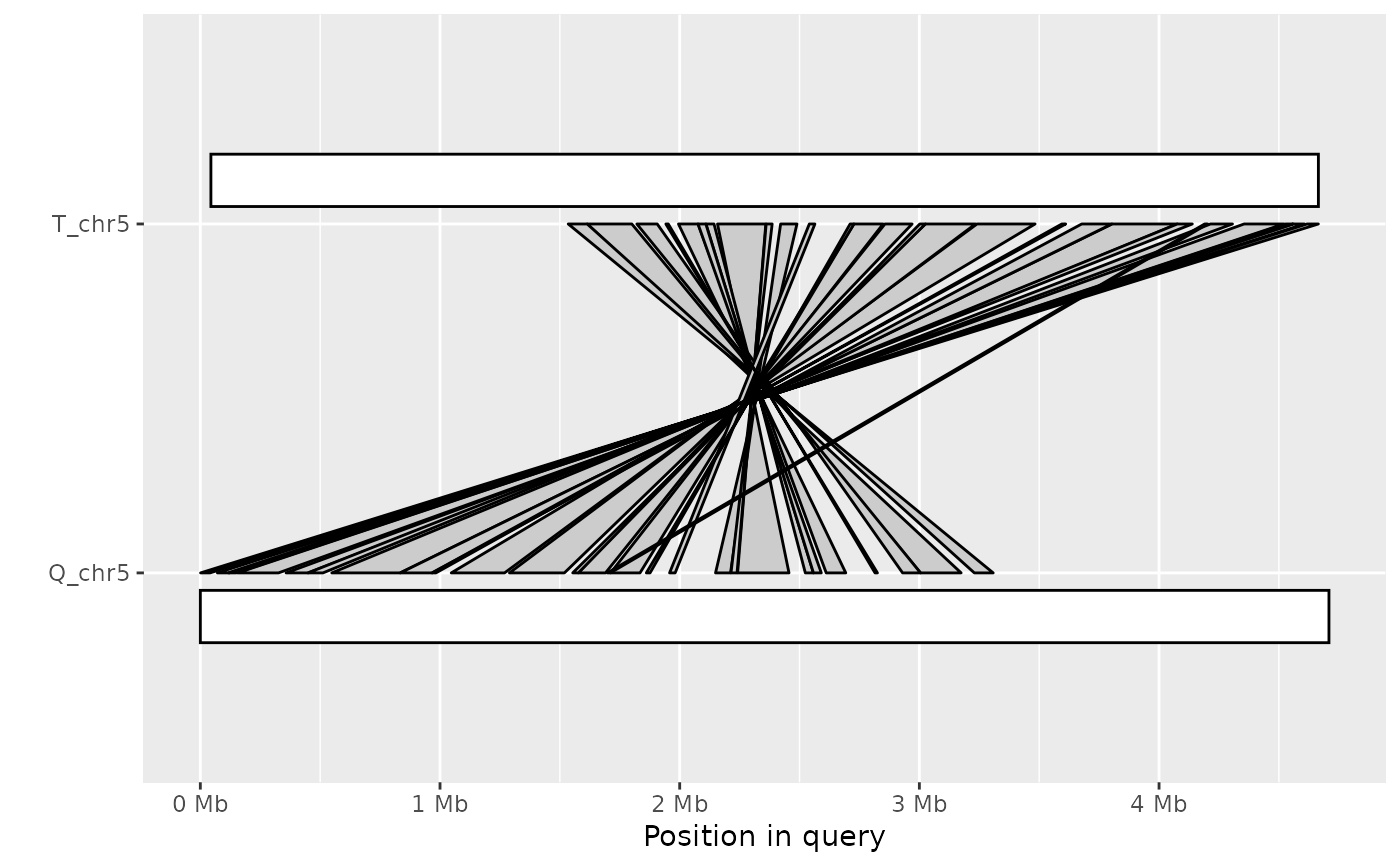
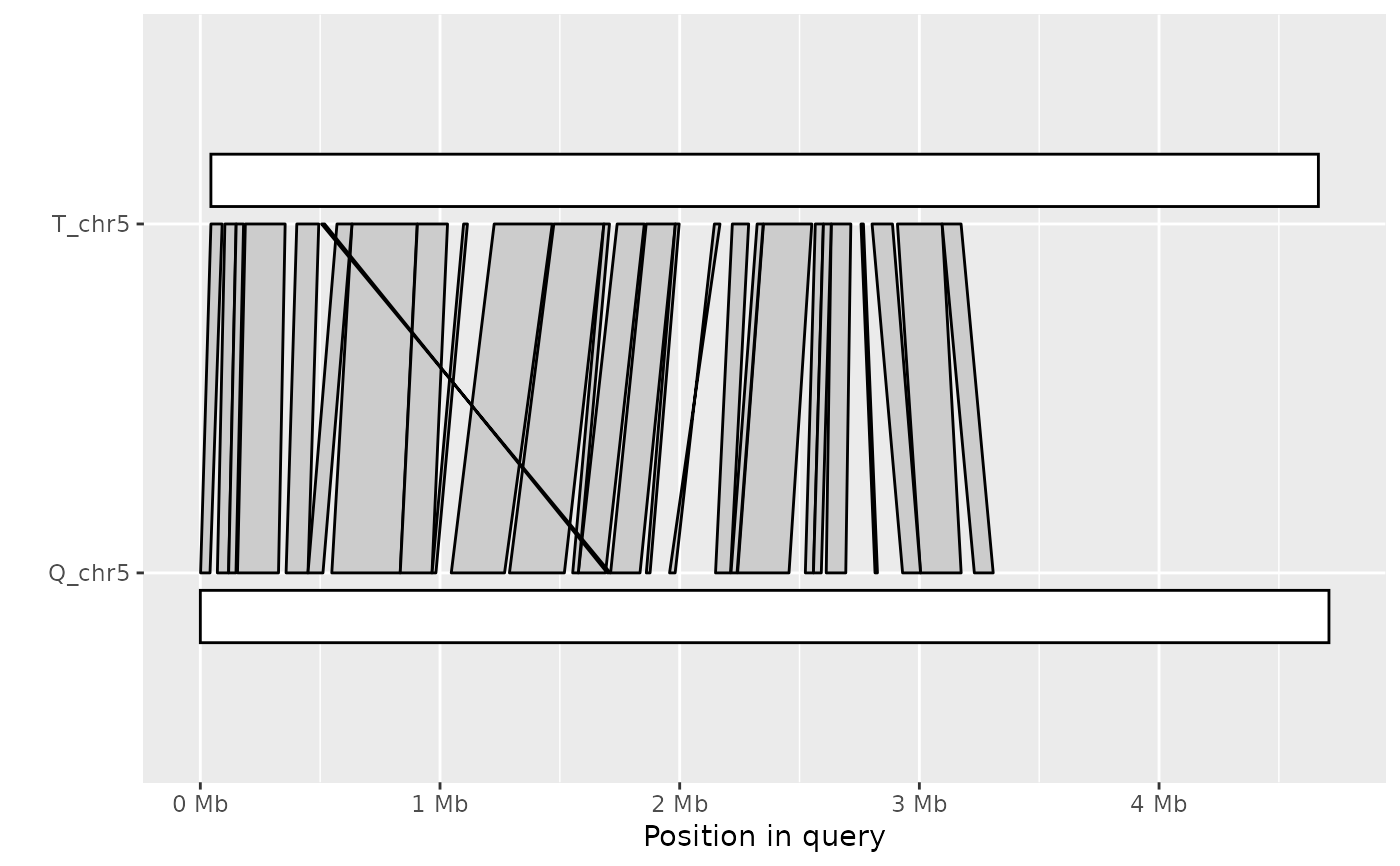
A ggplot object that displays synteny between query and target sequences
Examples
ali <- read_paf( system.file("extdata", "fungi.paf", package="pafr") ) long_ali <- subset(ali, alen > 1e4) plot_synteny(long_ali, q_chrom="Q_chr3", t_chrom="T_chr4", centre=TRUE)plot_synteny(long_ali, q_chrom="Q_chr5", t_chrom="T_chr5", centre=TRUE)plot_synteny(long_ali, q_chrom="Q_chr5", t_chrom="T_chr5", centre=TRUE, rc=TRUE)